The pipeline is the test
@da_poling| (1y ago)
The Riot Games API gives you a lot: match history, champion statistics, and performance metrics across dozens of dimensions. What it does not give you is anything that directly answers the question worth asking: how strong is this champion right now, relative to the rest of the roster, in a way you can actually trust?
Why raw metrics mislead
Raw win rates are polluted by sample size. Damage totals mean little without normalizing for role and game length. Popularity skews everything. A champion played ten thousand times this patch and one played forty times are not comparable on raw numbers, and many pipelines still treat them as if they are.
So I built one that did not. Scheduled ingestion, rate-limit-aware and incremental. Raw payloads stored separately from anything considered metric-ready so I could replay calculations without re-downloading data when definitions changed. A computation layer that aggregated across matches, normalized for sample size, and weighted against outliers. Leaderboard scores and tier groupings reading from the same derived layer.
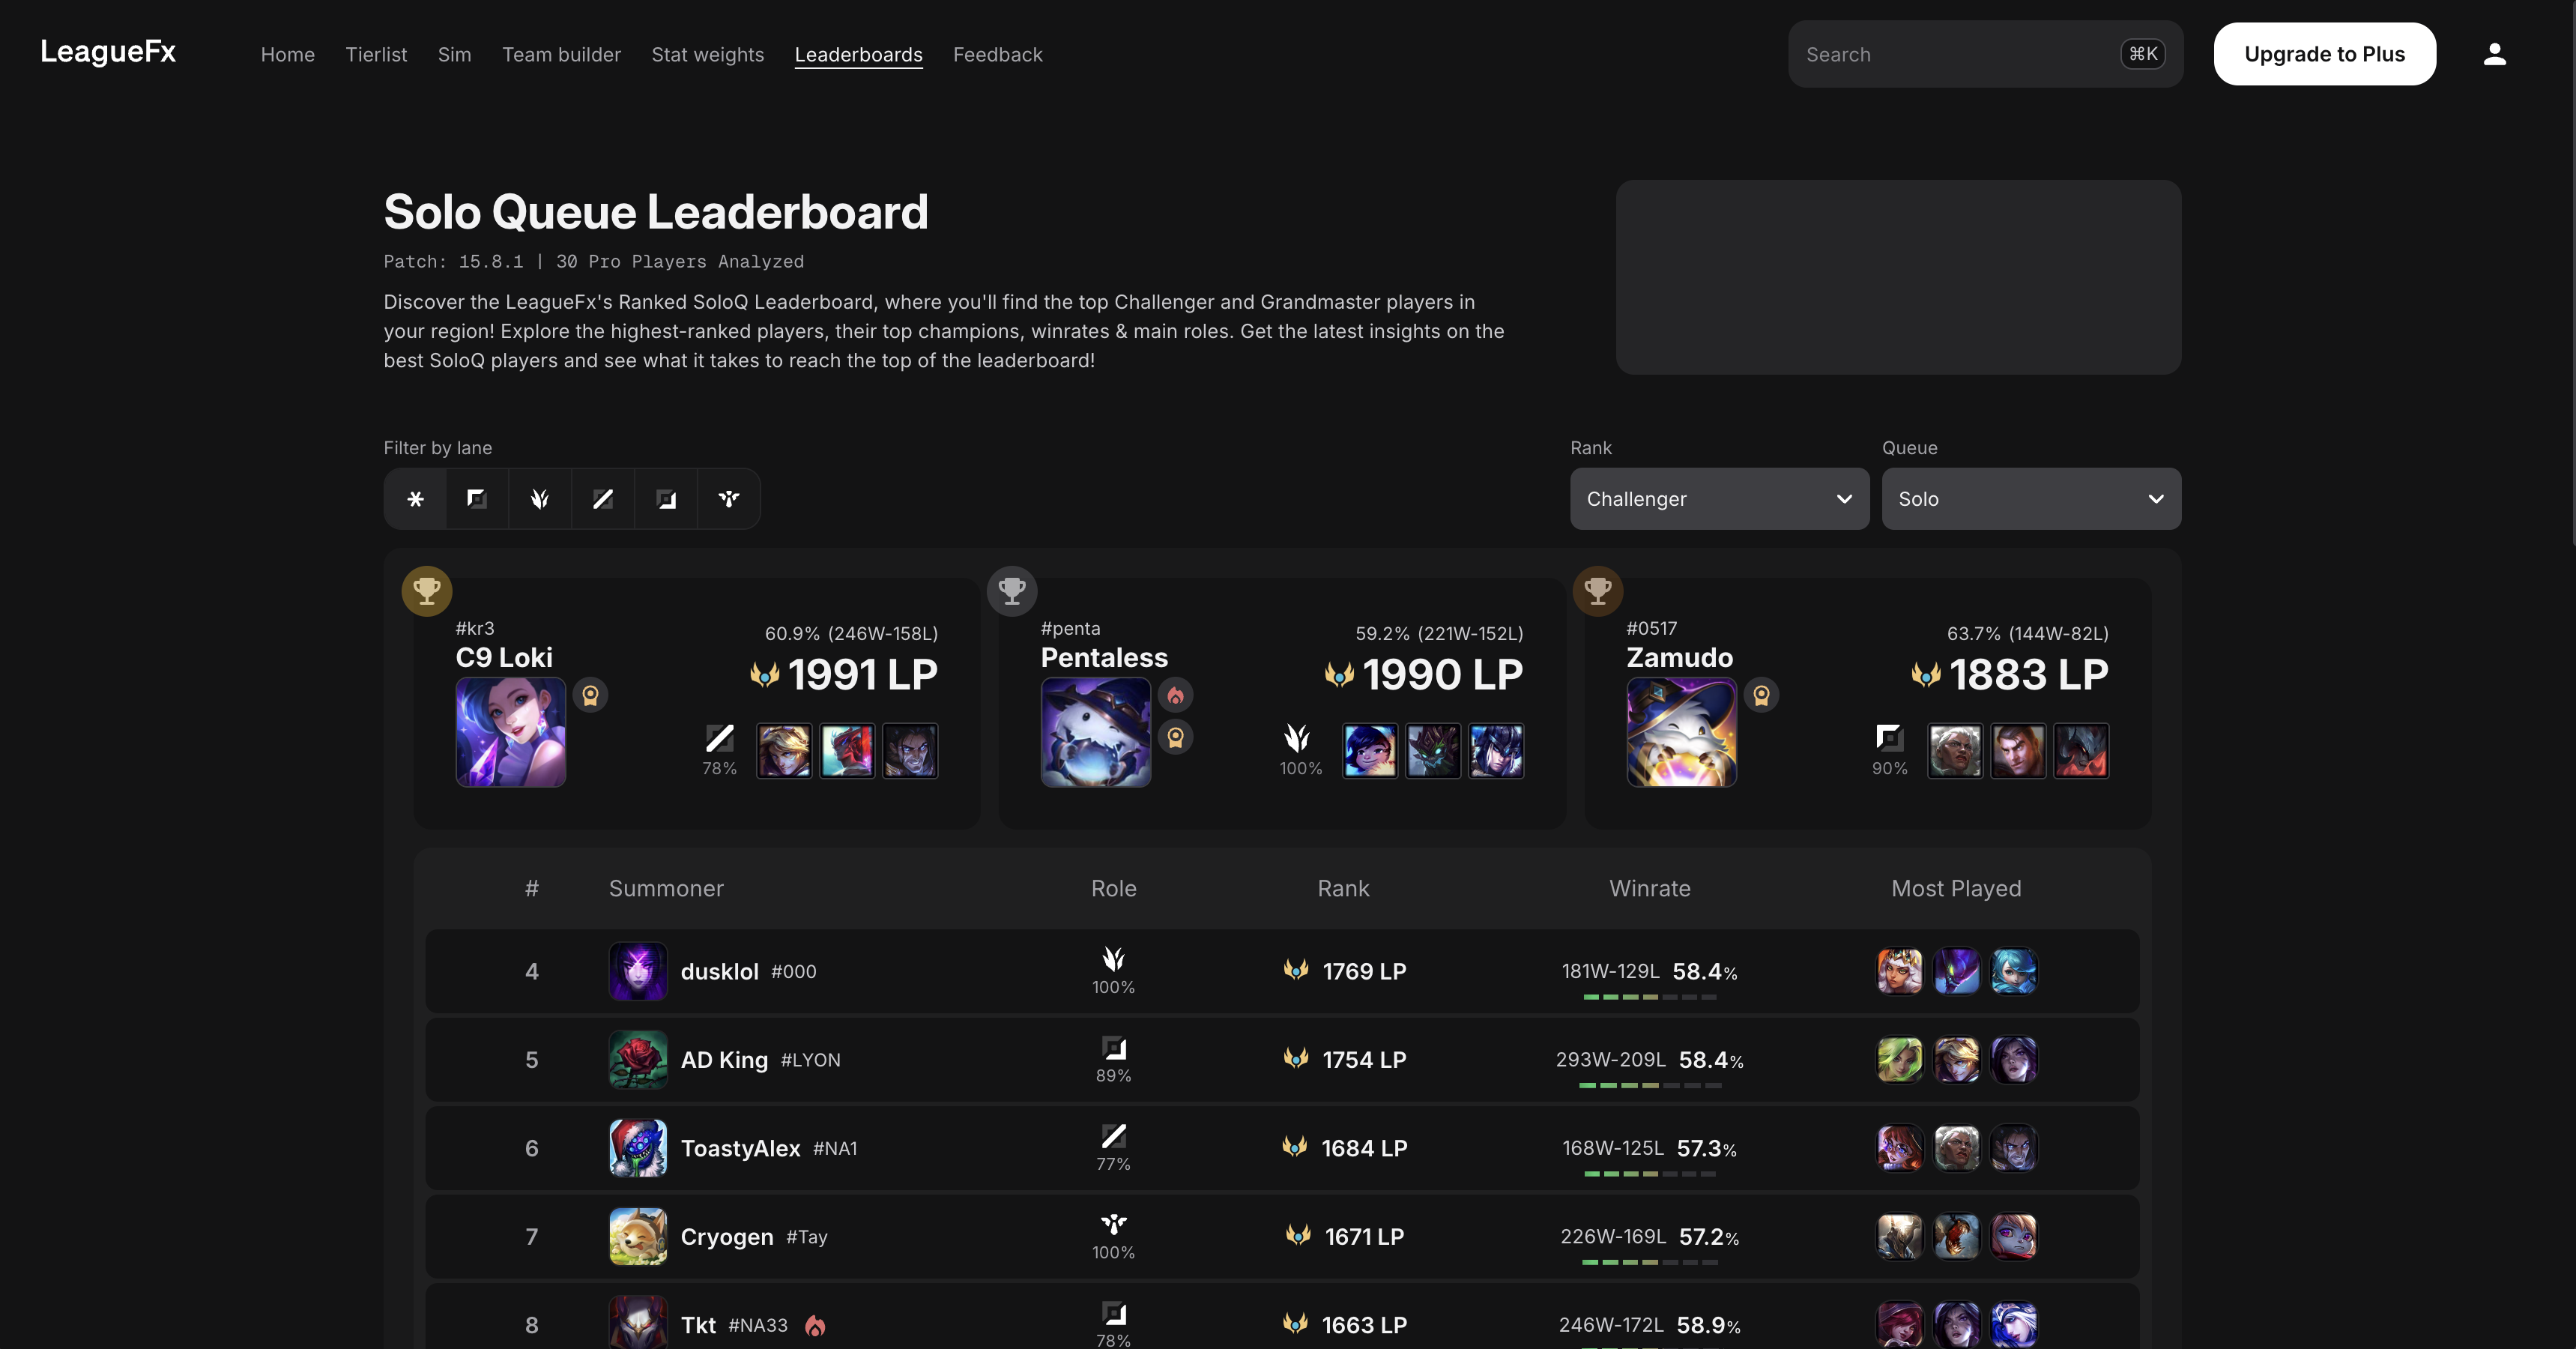
I spent too long on the ingestion layer before connecting it to anything downstream. The data coming in looked clean. The normalization logic looked sound. But I did not actually know whether any of it was producing something meaningful until I wired the full pipeline end to end: ingestion through computation through a UI that made the output readable to a human.
What surfaced in context
The moment I did that, problems I could not have found in isolation became obvious. Fields I thought I understood were interpreted differently than the model assumed. Sample distributions in certain patches were thin enough to make scores meaningless. Champions the pipeline ranked highly were champions any player would tell you were weak that week.
The data was not bad. The system gathering and interpreting it was incomplete. And an incomplete system produces output that looks correct until you see it in context.
That is the thing about data pipelines: you can spend a long time making one part excellent and still have no idea if the whole thing works. The only reliable approach is to build a rough end-to-end picture early, even when every layer is half-finished, and let the full system show you what is actually wrong. Connecting everything quickly surfaces problems that careful work on isolated components never will.
The pipeline is the test. There is no substitute for it.